The Power of Compounding: Why It’s Not Linear and Why It Always Wins
We’ve all heard it before — “Compounding is the eighth wonder of the world.”
But if you’ve ever stared at your investment statement after a few dull years in the market and thought, “Is compounding even working?” — you’re not alone.
Many investors imagine compounding as a smooth, straight line of growth. But in reality, it’s anything but linear. In the short term, the stock market behaves more like a heart monitor than a ruler — full of spikes, dips, and dramatic pauses. Yet, zoom out over a decade, and you’ll find that compounding silently and consistently works its magic.
Understanding Compounding — The Non-Linear Miracle
Let’s start with the core truth:
Compounding rarely means regular linear growth in stock markets.
However the longer you stay invested, it can mean exponential growth — where returns build on returns, creating an ever-widening gap between what you put in and what you get out.
But here’s the tricky part. The path of compounding, especially in equity markets, is not straight. It’s bumpy, unpredictable, and emotional. This non-linearity often makes investors doubt the process — especially during slow years or market crashes.
A Data-Backed Perspective: What History Teaches Us
To see this more clearly, let’s turn to the S&P BSE Sensex, India’s flagship index.
We studied monthly Sensex data from 2000 to 2025 to understand how long-term investors fared — even through three of the biggest market downturns in modern history: 2008 (Global Financial Crisis), 2011 (Euro Debt Crisis), and 2020 (COVID Crash).
Chart 1: Sensex — 25 Years of Ups and Downs
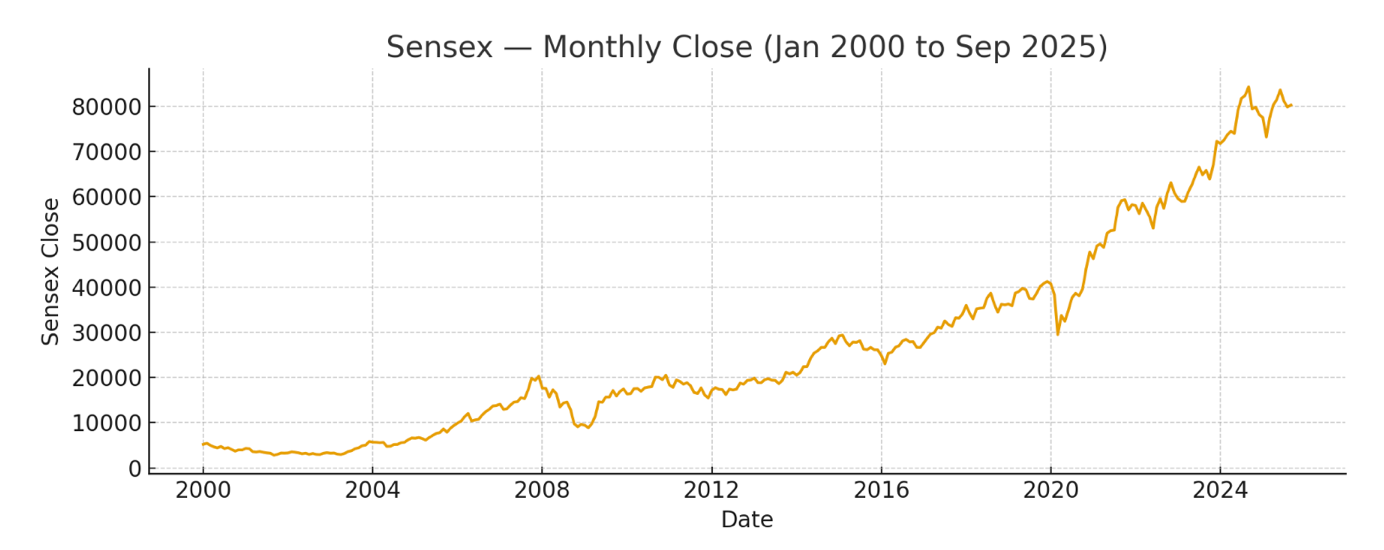 This chart shows how the Sensex has moved over the past 25 years — from around 4,000 in 2000 to well above 75,000 in 2025.
At first glance, you’ll notice several sharp drops, but what’s equally clear is the consistent long-term uptrend.
Rolling Returns: The Real Story of Compounding
While point-to-point returns can mislead, rolling returns help you see the true rhythm of compounding.
They show what an investor would have earned if they invested for a given time frame — regardless of when they started.
When we calculated 10-year rolling returns for the Sensex from 2000 onward, the insight was striking:
Chart 2: 10-Year Rolling CAGR of Sensex (2000–2025)
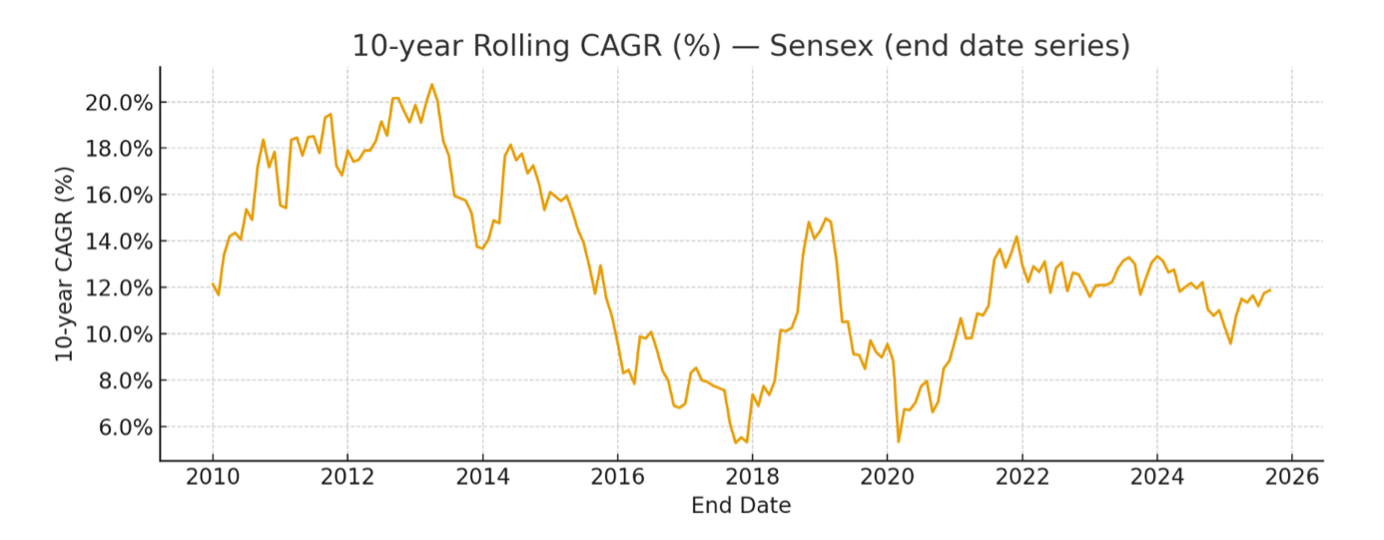
- Even through crises, 10-year rolling returns remained positive most of the time.
- The lowest dips coincided with global events — 2008, 2011, 2020 — yet recovery followed soon after.
- Over 90% of 10-year periods gave double-digit annual returns.
The Crash Case Studies: What Happens If You Stay Invested
Let’s decode this with real-world data.
We looked at how an investor who had been invested 10 years before each major crash performed — both at the time of the crash and just a year after.
| Crash (trough) | Start used | Start close | Crash close | Years (start→crash) | Annualised return (start→crash) | 1-yr later (end) | Annualised return after +1yr |
|---|---|---|---|---|---|---|---|
| Nov-2008 | Jan-2000 | 5,205.29 | 9,092.72 | 8.833 yrs | 6.52% p.a. | Nov-2009 — 16,926.22 | 12.74% p.a. |
| Dec-2011 | Dec-2001 | 3,262.33 | 15,454.92 | 10.00 yrs | 16.83% p.a. | Dec-2012 — 19,426.71 | 17.61% p.a. |
| Mar-2020 | Mar-2010 | 17,527.77 | 29,468.49 | 10.00 yrs | 5.33% p.a. | Mar-2021 — 49,509.15 | 9.90% p.a. |
| Crash Year | 10-Year CAGR (till crash) | 11-Year CAGR (1 year after crash) |
|---|---|---|
| 2008 | 6.52% | 12.74% |
| 2011 | 16.83% | 17.61% |
| 2020 | 5.33% | 9.9% |
What does this tell us?
✅ Even if you had invested a decade earlier — despite crashes, your returns were still positive.
✅ If you simply stayed invested for one more year, your CAGR shot up dramatically.
✅ The data proves that time, not timing, decides your wealth.
Why Compounding Feels Slow — Until It Doesn’t
In the early years, compounding feels almost invisible.
It’s like planting a tree — the first few years show little, and then suddenly, it blooms.
The same happens with money. The last few years of a 15–20-year compounding journey often contribute more to your wealth than the first ten combined.
That’s why the market’s sideways years — like 2015–2017 or 2022–2023 — aren’t failures.
They are the silent years where compounding roots deepen.
The Real Lesson for Investors
- Stop expecting linear growth. Compounding is exponential, not arithmetic.
- Market crashes don’t destroy compounding — they simply pause its visible effects.
- Staying invested through volatility is the only way to truly benefit.
- Patience + discipline = the twin engines of compounding.
Closing Reflection
When you understand that compounding is a curve, not a line —
you stop worrying about where the market is today
and start focusing on where it can take you in time.
So, the next time you see your portfolio stagnate, remember:
Compounding is still working, quietly, invisibly —
waiting to surprise you with results you can’t yet imagine. 🌱
Be the calm that money can’t buy, with wisdom stacked under your why.